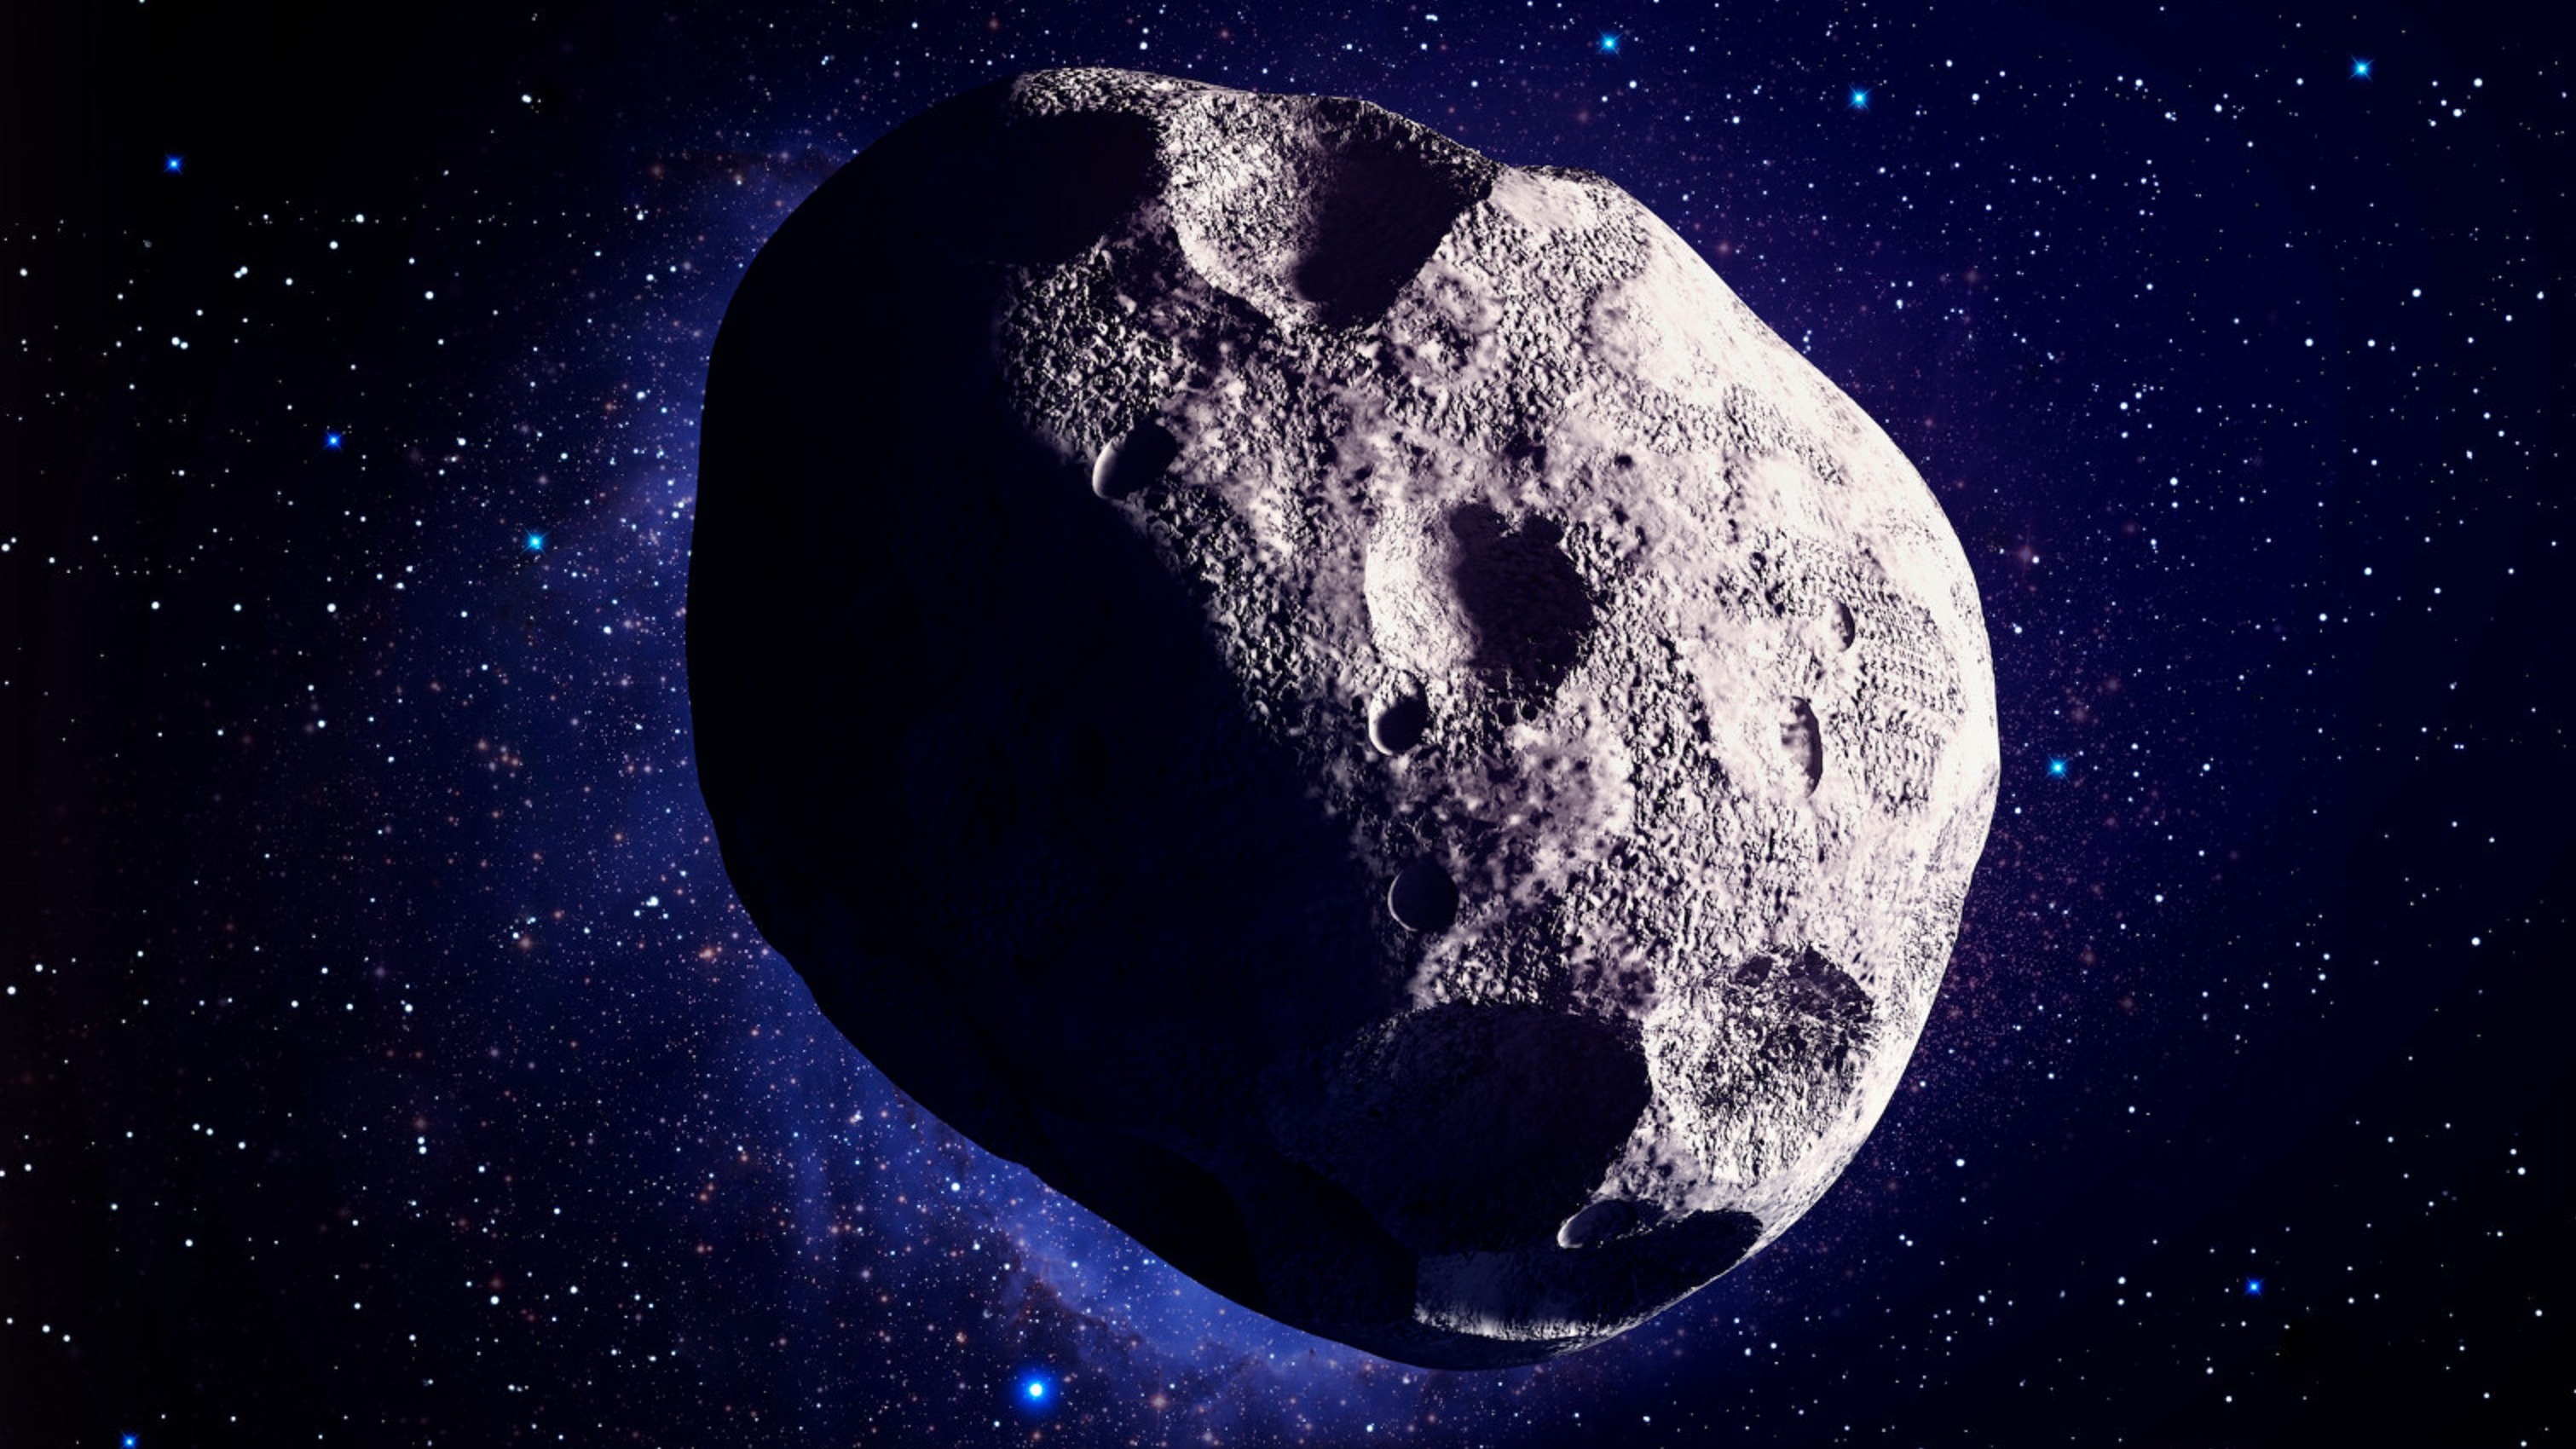
Asteroids
Fun Fact: Some Asteroids are so large, they have their own moons!
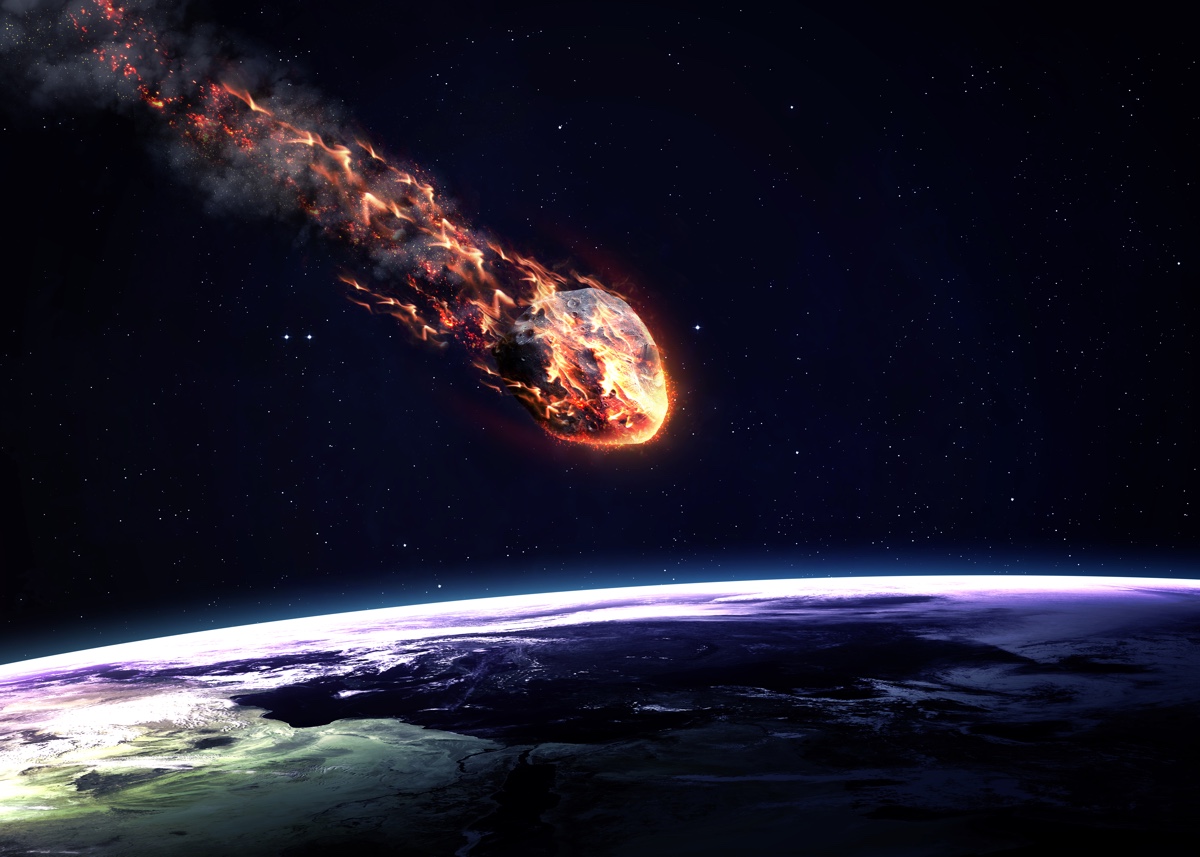
Fireballs
The most recent recorded fireball was on April 26, 2023.
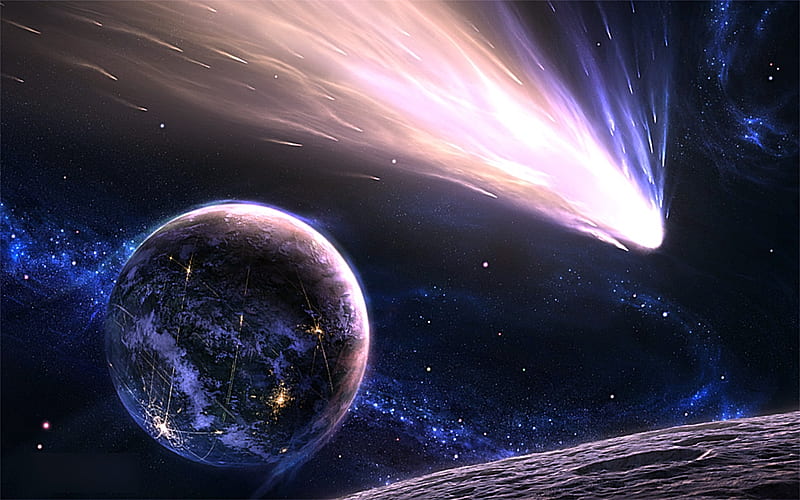
Comets
Fun Fact: Comets have their own atmospheres!
Fun Fact: Some Asteroids are so large, they have their own moons!
The most recent recorded fireball was on April 26, 2023.
Fun Fact: Comets have their own atmospheres!
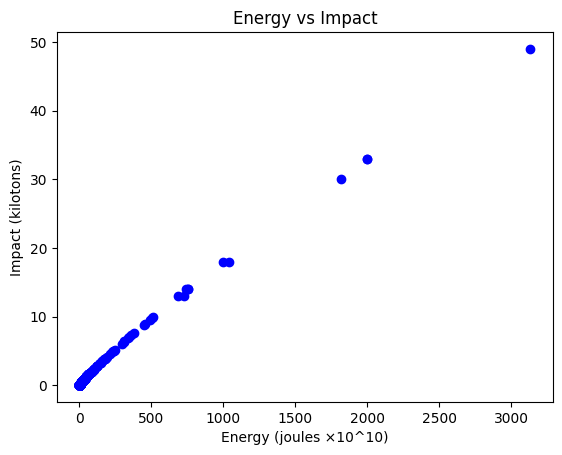
The graph below shows the energy each fireball had against the impact of each fireball. There is a clear direct relationship, but notice the very obvious point extremely far away. This is a clear outlier, and represents a specific incident gone over below.
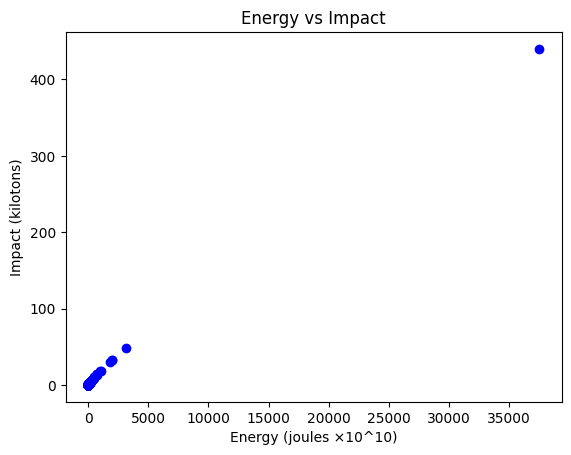
This was the far and away most dangerous fireball in the entire API. It occurrend in Russia on February 15, 2013. Some residents even said they felt the heat of it! Below we have the graph of the energy vs impact without the outlier, to solidify the fact of a direct relationship.
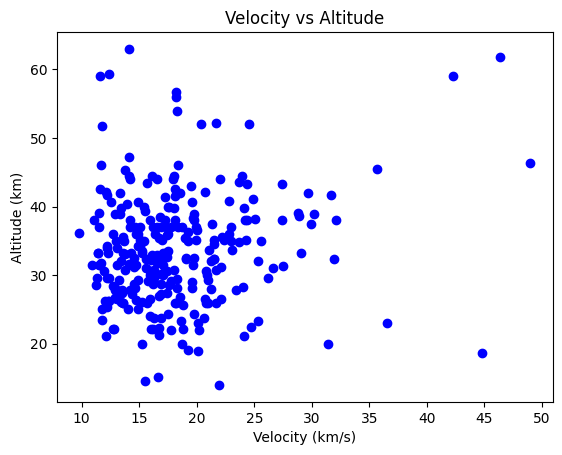
The graph below shows the velocity of each fireball at its brightest moment against the altitude of the fireball at its brightest moment. Suprisingly, there is no relation between the two at all.
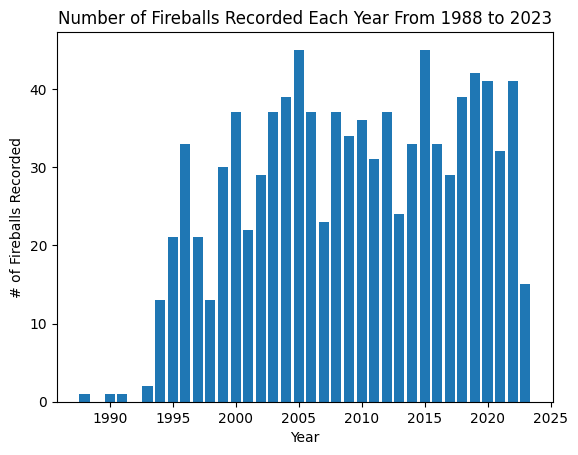
This is a graph of the number of fireballs that the US sensors picked up per year. The first few years may not be reliable since the technology was still new, which is probably why the number ramps up and then stays above 10 after 1994. Also, the last bar is 2023, so it is only about halfway throught the year, which is why it is relatively low.
The interactive graph below shows each fireball's position for every year they have been recorded. The four graphs are the four quadrants, NW NE SW SE, respectively. They are placed at their respective latitude and longitude.
This interactive graph takes the velocity of each comet and plots it against their closest distance to the sun. Similar to the fireballs, we found that the distance (or in the fireballs case, altitude) have no relation. Also, the distance here is in astronomical units, which is about 150 million kilometers! Even though the measurements are in the hundreths place, the comets are still millions of kilometers away.
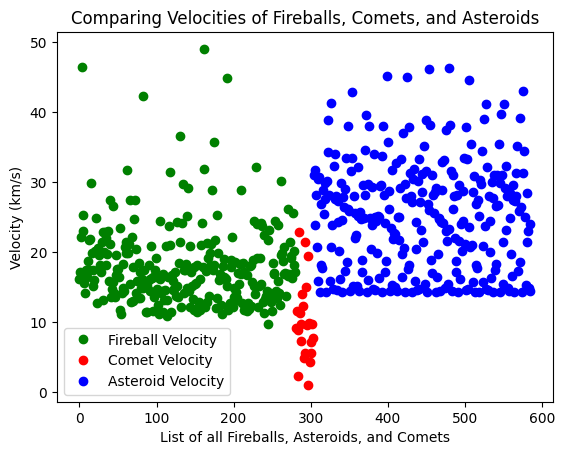
The graph below compares the velocity of every fireball, comet, and asteroid. There is no major differences between the fireball and asteroid velocities, while the comet velocities tend to be smaller.
The interactive graph below shows how close some asteroids get to Mercury, Venus, and Earth, each year. They are as big as their respective size, compared to the distance. Like in earlier graphs, the miss distance is in astronomical units, so the distance is is much greater than you might think! Also, these are predictions, which is why it goes all the way out to the year 2200.